You can use base Python to perform basic visualizations with a dataset. Let’s take a look at a few examples.
Let’s re-load in our Gapminder data:
1
2
3
import pandas as pd
url = 'https://raw.githubusercontent.com/jstaf/gapminder/master/gapminder/gapminder.csv'
df = pd.read_csv(url)
1
2
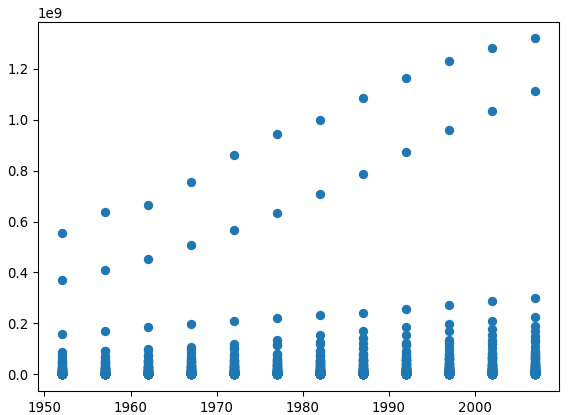
import matplotlib.pyplot as plt
plt.scatter(x = df['year'], y = df['pop'])
1
2
df_AF = df[df['continent'] == 'Africa']
df_AF.head()
1
2
3
4
5
6
##     country continent  year  lifeExp       pop    gdpPercap
## 24  Algeria    Africa  1952   43.077   9279525  2449.008185
## 25  Algeria    Africa  1957   45.685  10270856  3013.976023
## 26  Algeria    Africa  1962   48.303  11000948  2550.816880
## 27  Algeria    Africa  1967   51.407  12760499  3246.991771
## 28  Algeria    Africa  1972   54.518  14760787  4182.663766
1
plt.scatter(x = df_AF['year'], y = df_AF['pop'])
Base Python works well for simple visualizations, but Altair is a package that helps to create personalized and detailed visualizations to suit any task. See the article titled ‘Visualizing with Altair in Python’ to learn more about it.