So far, we have learned what meta-analysis is and how it is generally performed. In this section, we will dive into subgroup analysis—as the name suggests, this involves performing meta-analyses within specific groups in your dataset.
Subgroup Analyses
Subgroup analyses are especially important when there is high heterogeneity in your main meta-analysis, indicating differences across studies. By conducting subgroup analyses, we not only identify potential sources of heterogeneity, but also gain deeper insights into the data. Therefore, it is highly recommended to still perform subgroup analyses even if the overall heterogeneity is very low, so that you can gain more interpretation from your data.
Important Note: Subgroup analysis is usually performed using a Fixed model.
Finding source of heterogeneity
Let’s back to our sample dataset Sample Data. In the previous part, our meta-analysis on the entire dataset showed an I^2 value of 66.8% and a p-value of 0.0003, indicating significant heterogeneity across studies.
As a start, we can begin by performing subgroup analyses based on gender. Simply put, we want to understand how the effect changes when we separate the analysis by gender.
To perform a subgroup analysis by gender using the meta package in R, we can use the byvar argument in metacont(). Since subgroup analysis is typically done using a fixed-effect model, we’ll set comb.fixed = TRUE and comb.random = FALSE:
|
|
|
|
So we have the overall effect along with separate analyses based on gender (Results for subgroups).
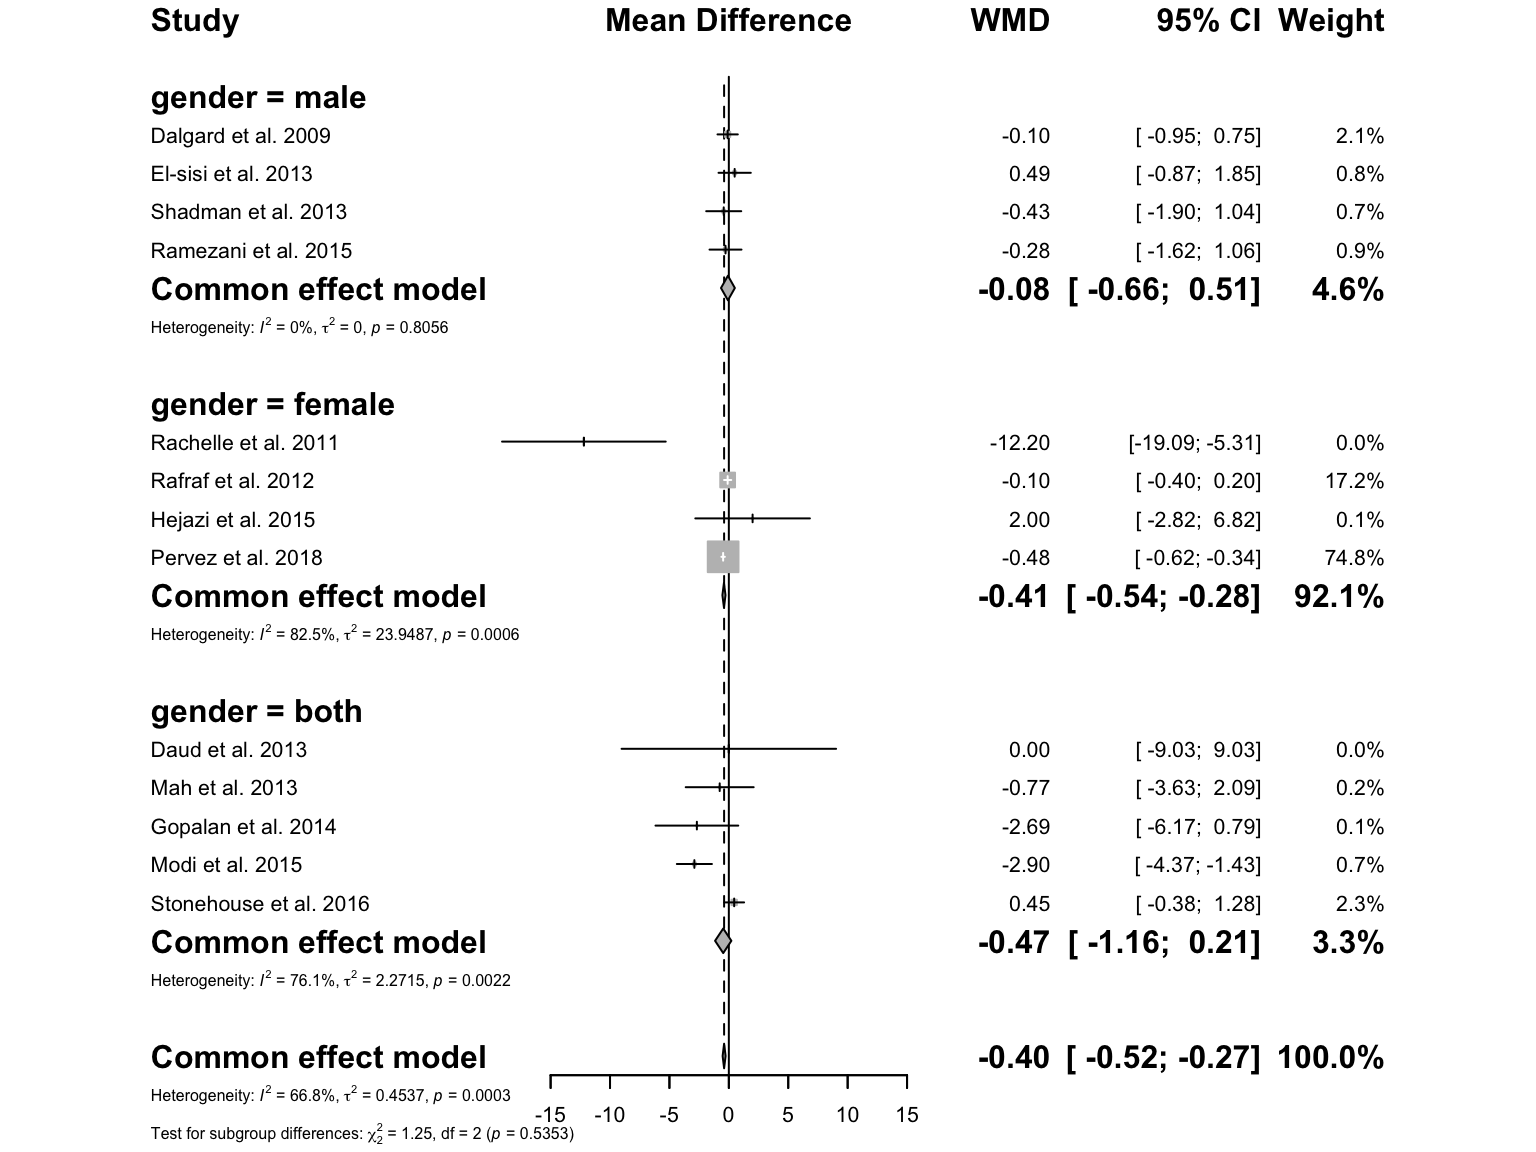
Now, let’s generate the forest plot for our subgroup analysis results:
|
|
As mentioned at the beginning, one of the goals of performing subgroup analysis is to determine whether the factor we are examining (such as gender in the previous example) is a source of heterogeneity. However, answering this question can be tricky, as different approaches may lead to different conclusions. Therefore, we must be cautious when interpreting our results.
Generally, there are two common approaches for identifying sources of heterogeneity, along with one formal statistical test:
-
1. Determination based on the findings of each subgroup (more valid): If the findings of the subgroups differ meaningfully (in direction or magnitude), the variable is likely a source of heterogeneity. This approach assumes that differences in effect sizes between groups (e.g., males vs. females) reflect true effect modification.
-
2.Determination based on the heterogeneity level of each group: If heterogeneity (e.g., I^2) is clearly reduced in one subgroup compared to the overall analysis, this suggests that the grouping variable may be contributing to the observed heterogeneity.
In addition, in the results, “Test for subgroup differences” is also provided, which includes:
-
Between-group p-value: This tests whether the effect sizes differ significantly between subgroups. It serves as a formal statistical test backing the first approach.
-
Within-group p-value: This shows whether significant residual heterogeneity remains within the subgroups, supporting the second approach descriptively.
Note: The interpretation of the source of heterogeneity in any meta-analysis study should be based on one of these two approaches.
In our example, the results for males, females, and the both genders combined group showed a similar direction and magnitude of effect. For males, the mean difference (MD) was -0.0764 (95% CI: -0.6605 to 0.5076); for females, MD was -0.4114 (95% CI: -0.5417 to -0.2811); and for both genders combined, MD was -0.4722 (95% CI: -1.1591 to 0.2146). This suggests gender may not be a strong effect modifier. The p-value from the Q-test was 0.5353, indicating that the differences between gender groups are not statistically significant. However, the male subgroup showed no heterogeneity (I^2 = 0%), while the overall heterogeneity was high (I^2 = 66.8%). This suggests gender may be contributing to the observed heterogeneity.
🔎 Conclusion: While the formal statistical test does not support gender as a significant source of heterogeneity, the reduction in I^2 in the male subgroup hints at a possible role. These results should be interpreted with caution and may warrant further studies.
The interpretations within each subgroup
In our example, another interpretation of the subgroup results involves examining how gender influences the effect of Vitamin E on blood CRP levels in adults.
From the results:
-
In males, the reduction in CRP levels was not statistically significant (MD: -0.0764, 95% CI: -0.6605 to 0.5076), while in females, the effect of Vitamin E was statistically significant and greater in magnitude (MD: -0.4114, 95% CI: -0.5417 to -0.2811).
-
This suggests that Vitamin E may have a more pronounced and statistically significant effect in reducing CRP levels among females compared to males, indicating a possible gender-specific response to the intervention.
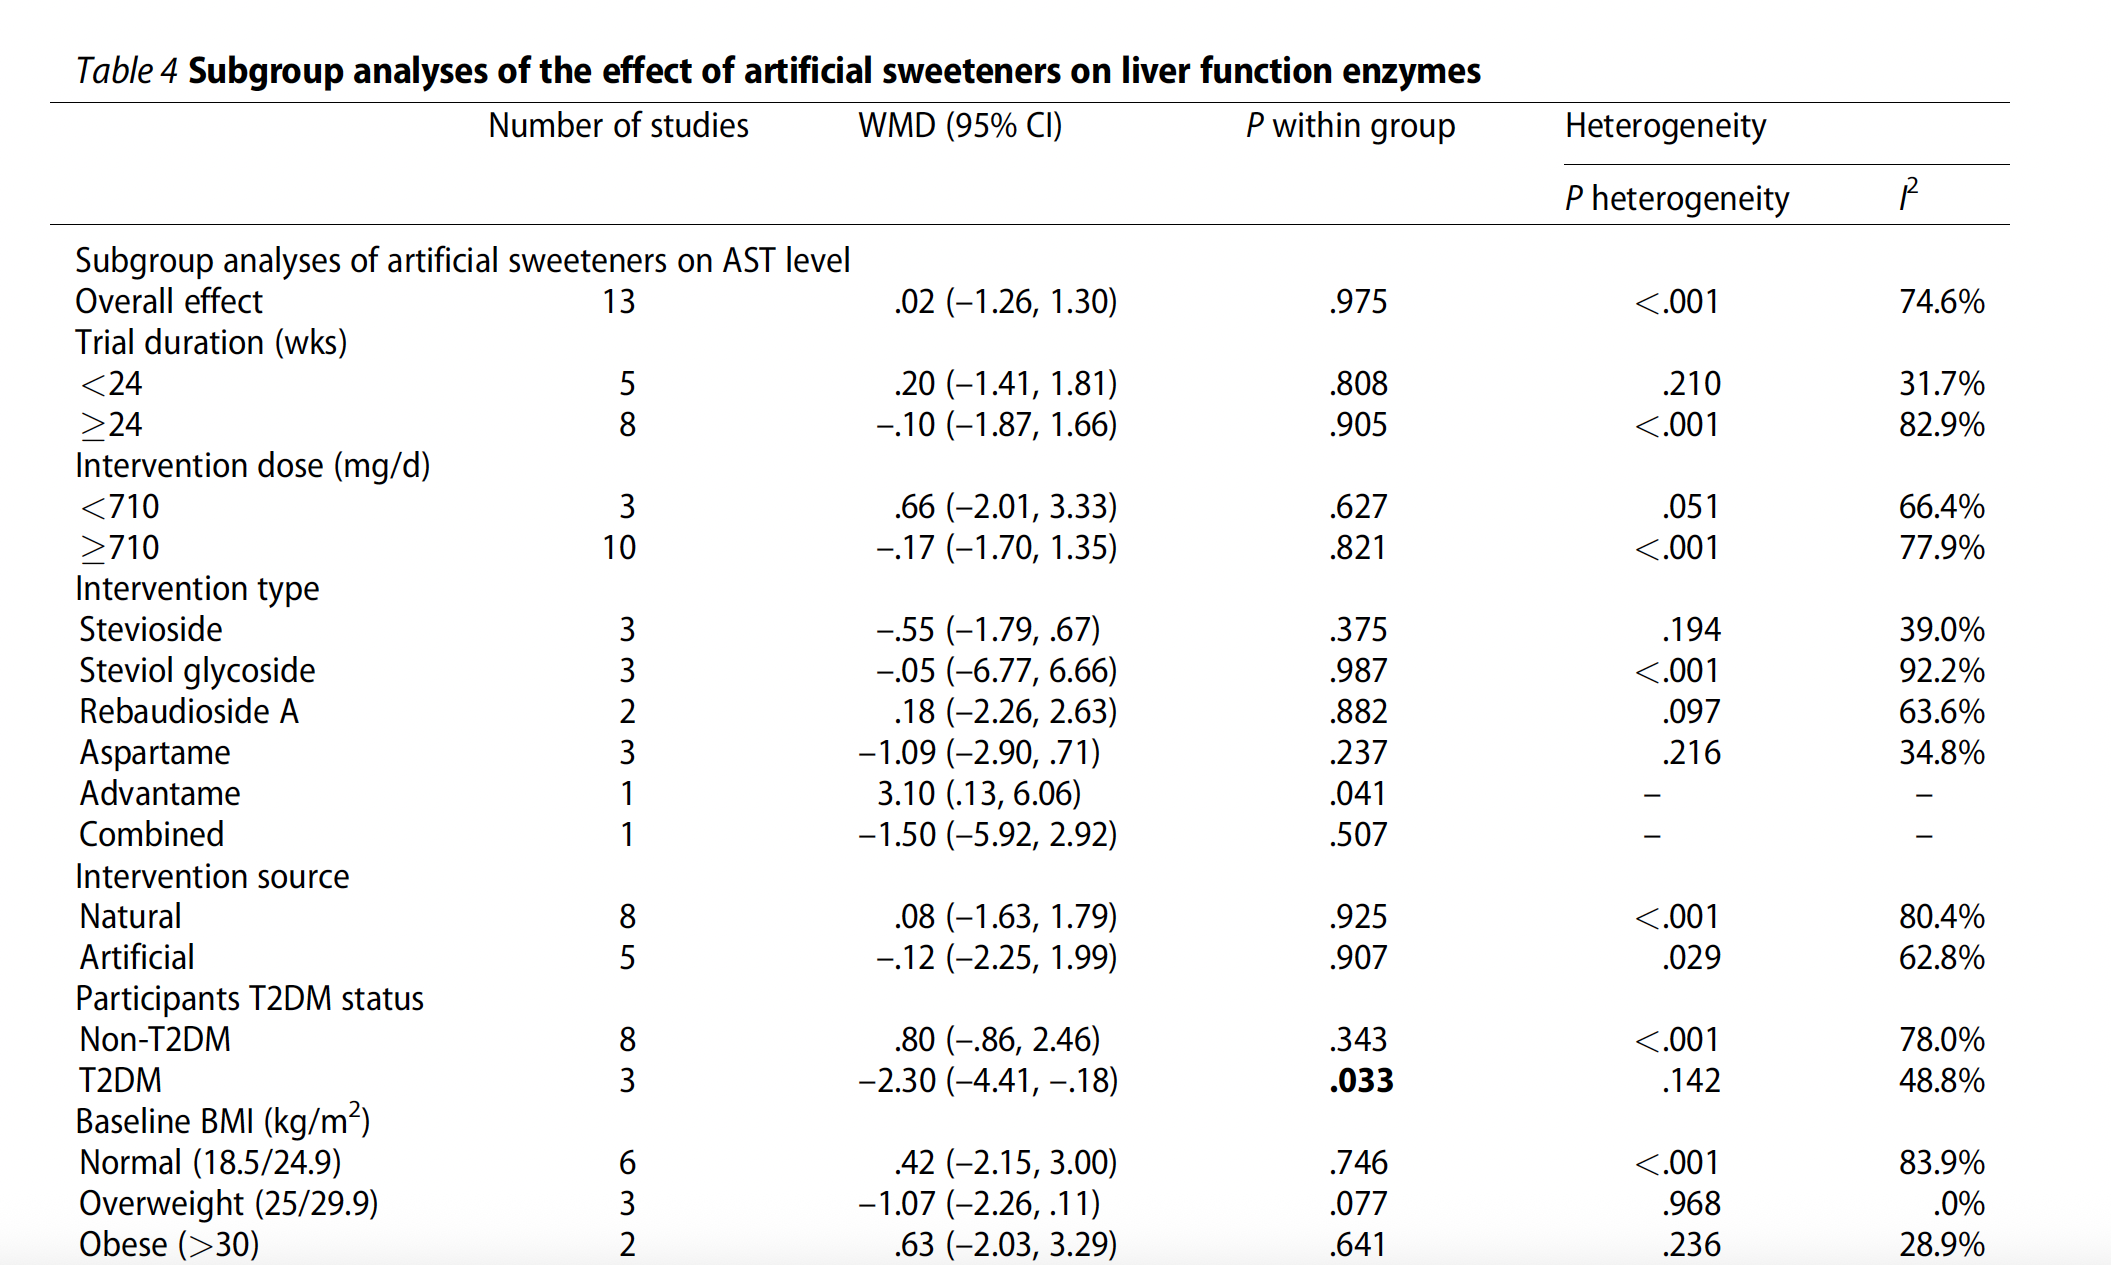
Note: In papers, subgroup analyses are usually reported in a table, as there can be many factors involved. Some journals may also request forest plots to be included as supplementary material. Here is an example (Golzan et al. 2023):
Note: There is also another way of finding the source of heterogeneity known as meta-regression, which is beyond the scope of this series of posts. If you would like to learn more, you may refer to: Cochrane Handbook - Chapter 10
So our subgroup analyses can be extended to other factors as well, like assuming how the trial duration or intervention type can affect the overall results. These factors should be selected based on your research questions, domain knowledge, and the possibility of performing with your dataset.
Important Note: Subgroup analyses based on population characteristics require greater caution than those based on study characteristics. This is largely because of challenges in ensuring that subgroup samples are representative. These subgroup findings are often best treated as hypothesis-generating rather than conclusive.
This brings us to the end of our series on meta-analysis. While we’ve covered key concepts, there’s still much more to explore in meta-analysis studies, such as dose-response analysis, sensitivity analysis to assess how much the overall effect size depends on individual studies, evaluation of publication bias using tests like Begg’s and Egger’s, and funnel plot visual assessments. Other important areas include certainty assessment, quality assessment, and more. For comprehensive guidelines and detailed methodology, refer to the Cochrane Handbook by Julian P. T. Higgins and Sally Green.